I found the free Active Directory Topology Diagrammer (ADTD) tool which you can download it here.
As stated in Microsoft’s description on the tool download page, ADTD connects to the Active Directory through LDAP and then creates the topology of the Active Directory and/or Exchange Server infrastructure. Charts include domains, sites, OUs, DFS-R, etc., and can be modified through Microsoft Visio.
The good thing about ADTD is that it automatically creates the charts of an AD infrastructure in Visio, so you do not have to start creating them from scratch. The bad thing is that on the computer running ADTD it is necessary that Visio is installed. Not just a Visio Viewer, the full version of Visio.
Let’s look in more detail at the available settings and charts created by the Active Directory Topology Diagrammer (ADTD).
Active Directory Topology Diagrammer settings
Initially, at the top of the application, you will need to type the name of a DC or GC Server infrastructure. Through this, all the necessary information will be collected.
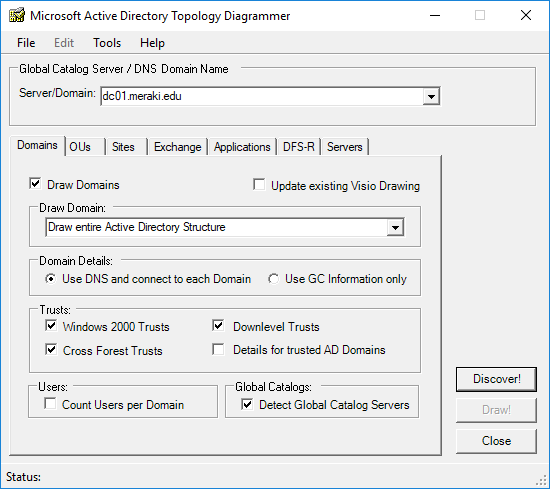
Then, in the following tabs, you will need to select the settings you want to be printed on Visio charts. If you are running ADTD for the first time, make sure Draw Domains, Sites, etc. are selected, and if you want to refresh previously created charts, select Update existing Visio Drawing.
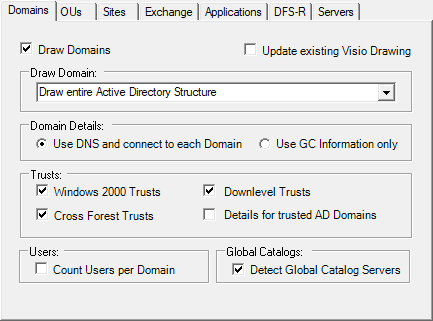
On the Domains tab, you can choose to create a chart for trusted domains as well as the number of users for each domain.
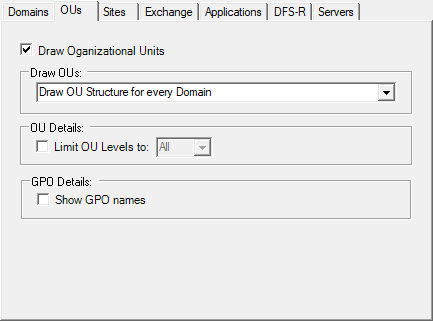
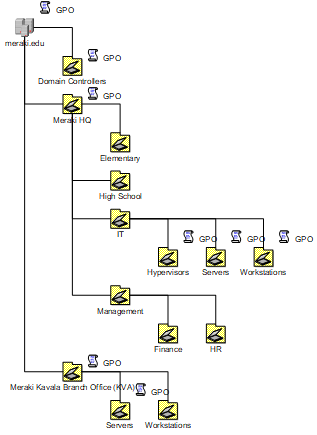
On the OUs tab, you can set a limit at the level of OUs to be formed and display the names of the GPOs applied to each OU.
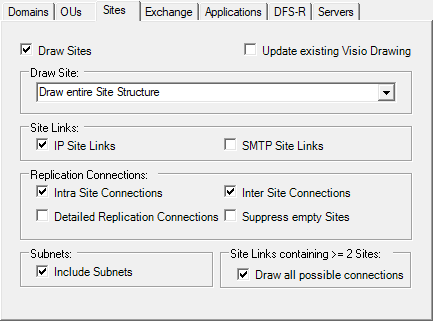
On the Sites tab, select whether or not Site Links, Subnets, Blank Sites, and all possible Links for Sites with more than 2 are displayed.
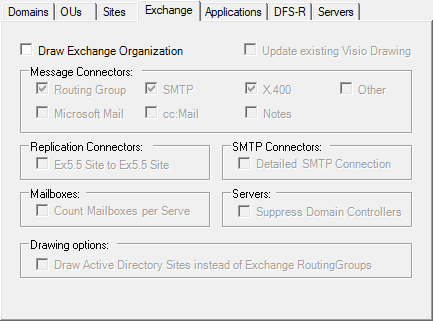
On the Exchange tab, as shown in the picture, you can create diagrams for message, replication, SMTP connectors, mailboxes, etc.
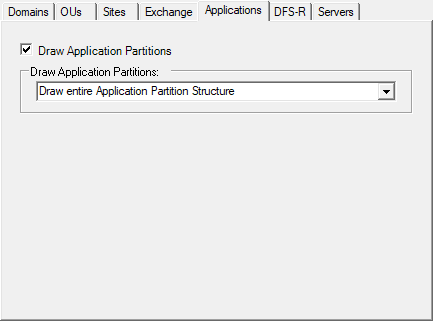
On the Applications tab, you do not have many choices unless the chart is created or not.
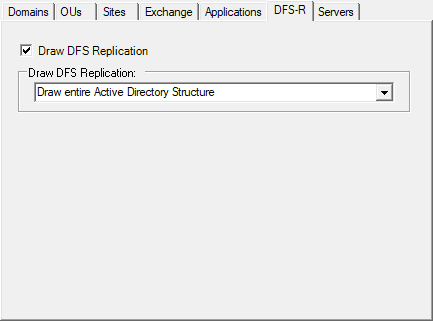
The same applies to the DFS-R tab.
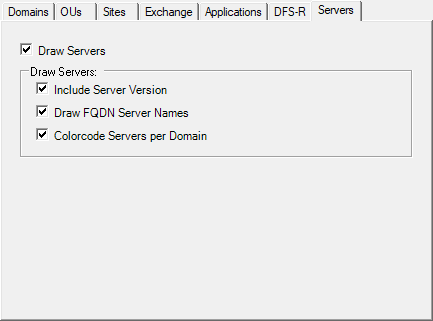
Finally, on the Servers tab, you can choose whether to display the version of Windows Servers, their names and whether they will be colored depending on the Domain they belong to.
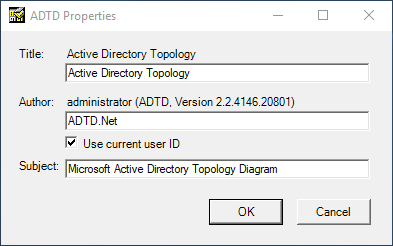
Since we are talking about the settings, clicking on File and then Properties will display the basic settings window for the charts, ie their title, author, and theme.
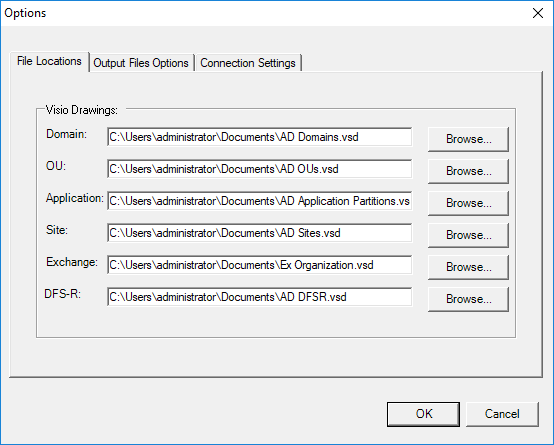
Additionally, you can view and change the storage location of the Visio diagrams that will be created through the options pane found on the Tools – Options menu.
Using AD Topology Diagrammer and charts
Once you have selected all the information you want to capture on the Visio diagrams, you are ready to create them.
First, click on the Discover button to start scanning all the necessary information. Once finished, the button will become gray and the Draw button will be activated, which will give the command to create the charts.
Then, wait until the process is complete and Visio automatically opens. Now you will be able to view and edit all the charts as you like.
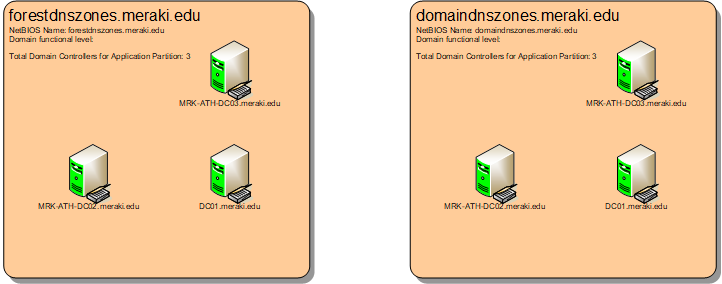
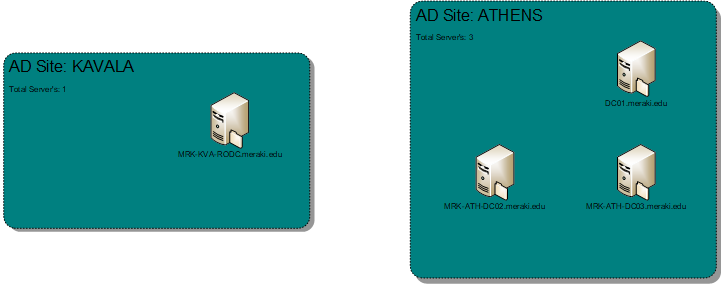
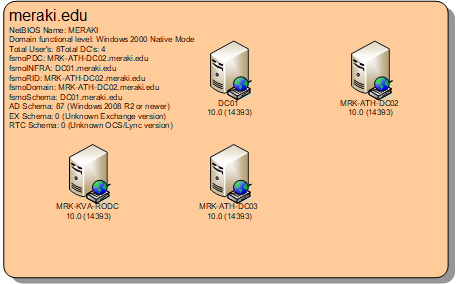
To give you an example, in the following screenshots, you can see the charts created by the Active Directory environment of my homelab. Note that although most information is accurate, Domain and Forest’s Functional Levels are wrong. Reasonably, if you consider the tool to be renewed from 2011.

Got a project that needs expert IT support?
From Linux and Microsoft Server to VMware, networking, and more, our team at CR Tech is here to help.
Get personalized support today and ensure your systems are running at peak performance or make sure that your project turns out to be a successful one!
CONTACT US NOW

