Introduction
Every Microsoft Windows server should be monitored for performance issues, but if you have nothing to compare it against, how do you know when its over worked or ticking over?
Steps (6 total)
Opening the tool
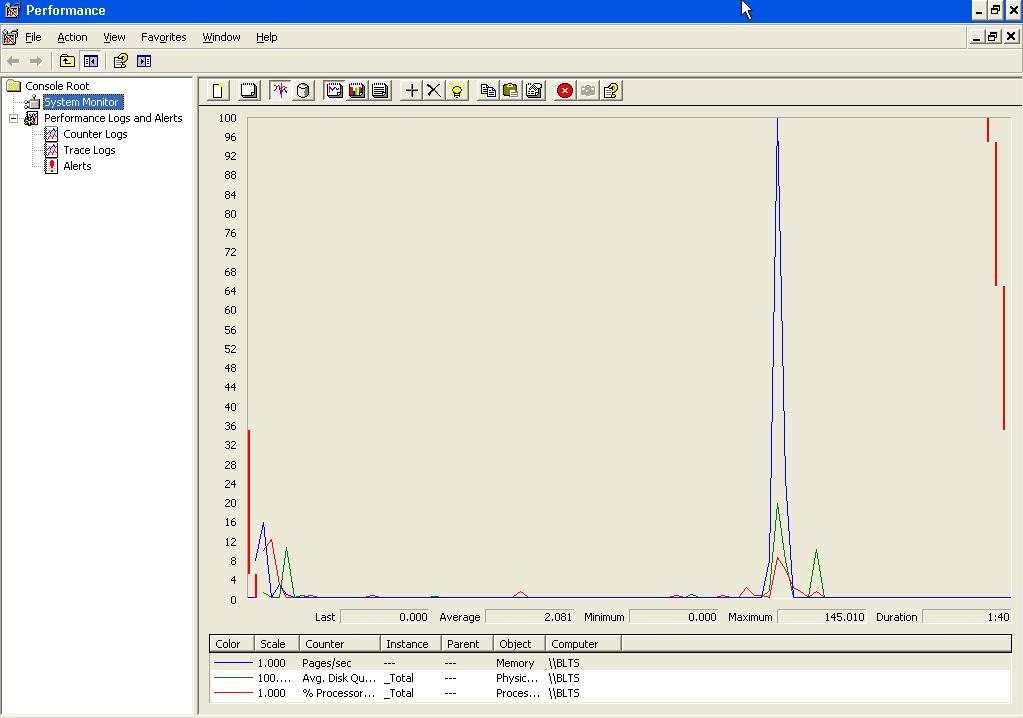
First open performance monitor on the server (you can run or setup a schedule from your own machine with domain admin rights, but i won’t cover that in this demo)
The images will be from a server console.
The performance icon can be found in the control panel under Administrative tools
Once opened, it gives you 3 counters with current utilisations.
Selecting objects or counters
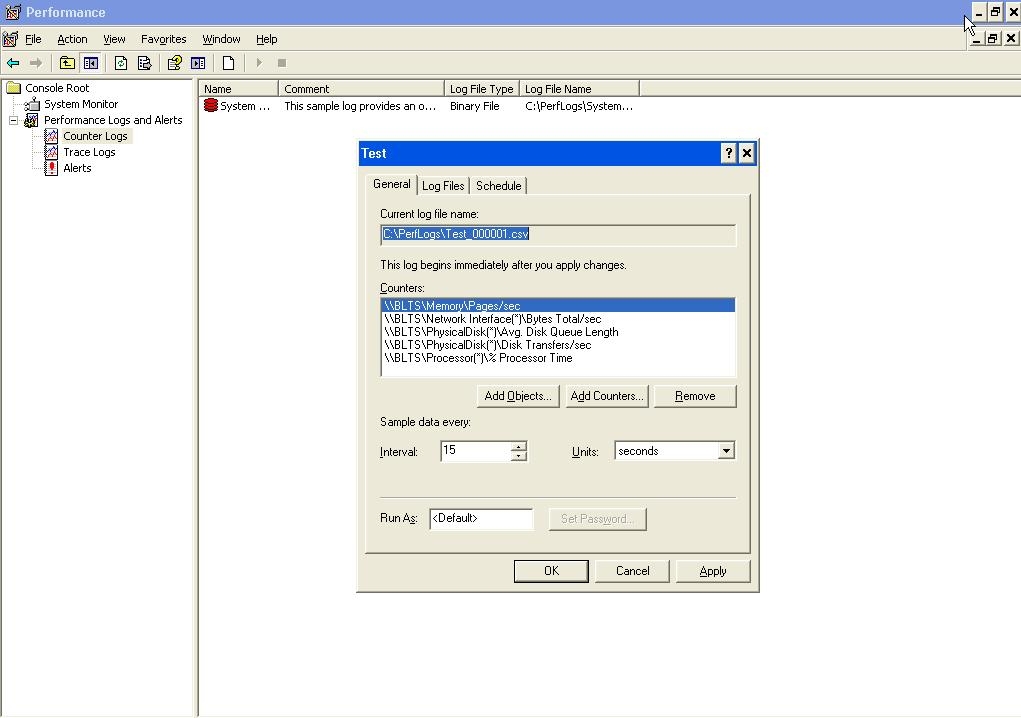
The big question of performance monitoring is ‘What do you want to know’ – this all depends on what the function of the servers is – if its an SQL server, you will want to monitor SQL performance objects more than other objects, if its a general data and print server then just monitoring the CPU, Memory and disk activity is a good start.
The difference between an Object and a Counter is – the object is the whole item – i.e. the Processor as a whole. The counter allows you to dig a little deeper and monitor different aspects of the Object – i.e. Dual Core – Both cores.
For recommended baseline objects and counters – see the reference link i have added.
Creating and selecting a new log
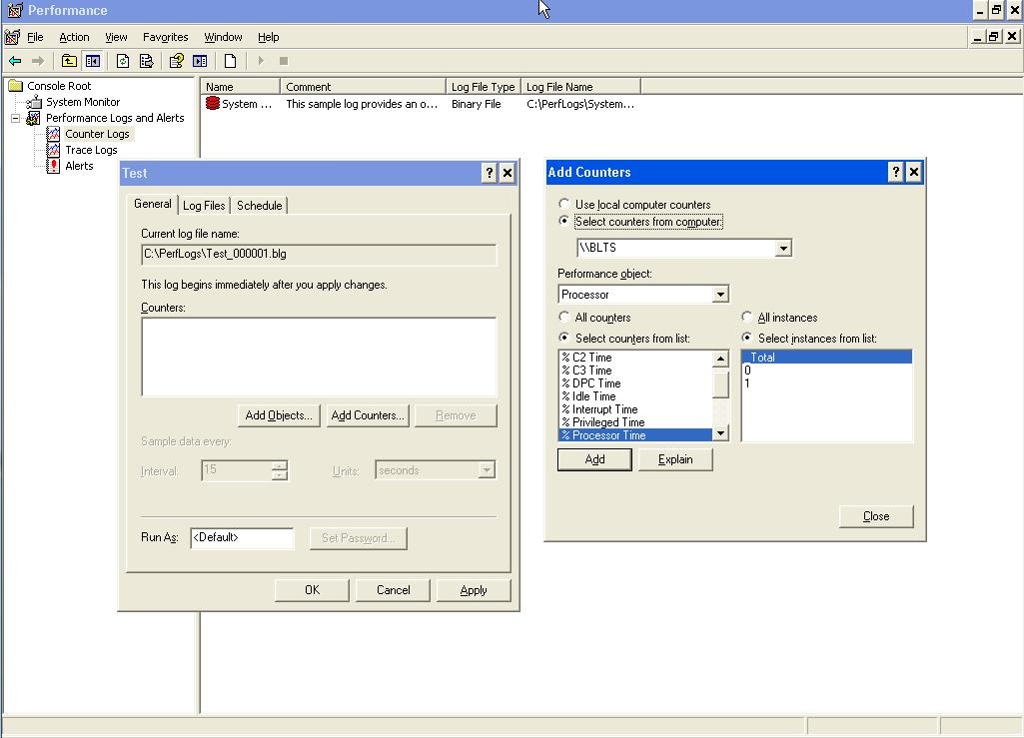
Expand the Performance Logs and Alerts section and select Counter Logs.
In the right hand window, right click and select ‘New Log Settings’
Give the new log a name – i’ve called mine ‘Test’ for the sake of this demo.
Then select the ‘Objects’ or ‘Counters’ you wish to monitor.
(see next section)
Log files and scheduling
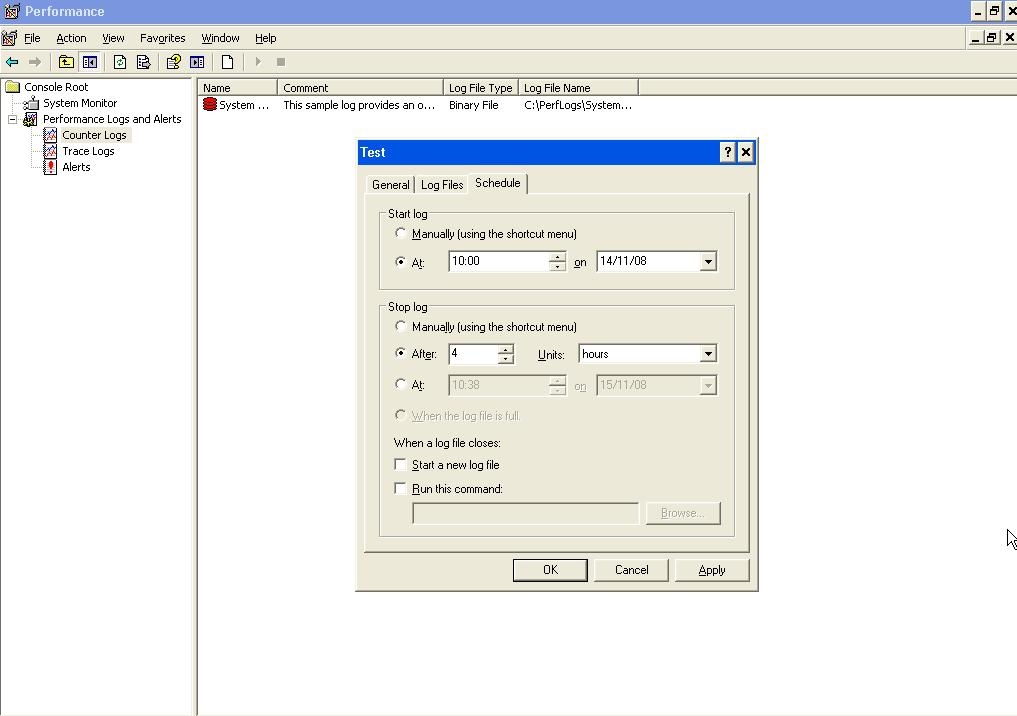
Once you are happy that you are monitoring the correct aspects of your server, and at the correct interval (This depends on how long you wish to monitor the performance – if its over the course of a whole day, every 15 seconds is a little too much!), move on to the log files tab and change the location and type of log file you wish to save. The defaults are normally ok.
The Schedule is the important Tab – in order to get a good baseline, you need to run the monitor at a time when the server is doing an average workload – there’s no point running the counter at night if no one is in – the server will be doing nothing. On the same contrast, don’t run the counter when everyone is working flat out, i.e. 15 minutes before your company has to hand in a tender!
Select a good time and day to run the baseline, go back and keep changing the day and time to compare results; making sure you are getting an average workload.
My example schedule will run Automatically from 10am, after the intial login load has passed – till 2pm. covering morning working, lunch time slow down, and lunch time peak return.
It useful to note that this scheduled job will run as a service and once submitted, the performance monitor program can be closed.
You can submit multiple jobs to run at multiple times with multiple counters in each.
Viewing the results.
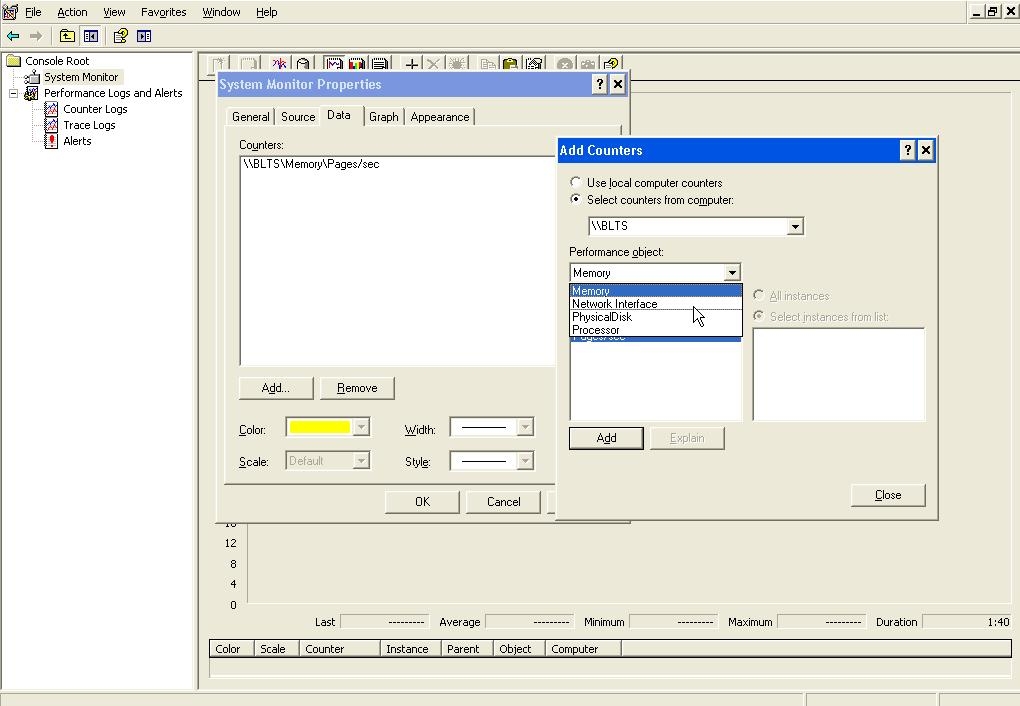
Now that you have created the baseline – set the schedule and the counters have run – you need to look at the results.
Go back to the Performance monitor application.
Select the System Monitor icon in the left hand pane – and remove all current counters by clicking the X button accross the toolbar in the right hand pane until no counters exist.
Now you need to load in the log file.
On the toolbar, the 3rd button in from the left – is the ‘view log data’ button – or CTRL L.
Select this and when the window opens you need to point it to the correct log file you created – if you selected the defaults this will be C:\perfmon\Xxxx.Csv
Load this log file in to the data source window, then select the Data Tab.
This is where you can select all or some of the counters in the log to view in the chart.
In the same way you added the counters, go back and add them back in to the counters to view window.
When you have finished – click OK and all the counters will show in the chart.
Troubleshooting & Analysing
One item you need to be aware of is the Performance Service – this needs to be set to Automatic in the services section in control panel in order for Schedules to run. If this is Disabled the performance counters will not work.
Now that you have your graph, you need to analyse the data.
To make it easier to view each counter – select it in the bottom window and click on the ‘Bulb’ icon on the toolbar to highlight its result – this is especially handy when you have lots of counters.
When you look at the results, try and view them in consideration of what might have been happening in the company at that time.
Now that you have your baseline, you have something to compare all other performance logs too – you can now go back and run the counters at quiet night times – when the backups are being run, or when the company is running at peak times. This allows you to compare and contrast the results and take action as necessary.
Conclusion
The Performance tool is very powerful,but because of this can be quite confusing as to what to monitor and what the results mean.
The best way if you are just starting out using this tool is to select one counter only and monitor this on your server – make it one that you can understand like CPU time or Memory pages/sec. Then work upwards from there.
Thanks for reading and happy monitoring!
Got a project that needs expert IT support?
From Linux and Microsoft Server to VMware, networking, and more, our team at CR Tech is here to help.
Get personalized support today and ensure your systems are running at peak performance or make sure that your project turns out to be a successful one!
CONTACT US NOW

